Visual bot building
Creating your first visual bot
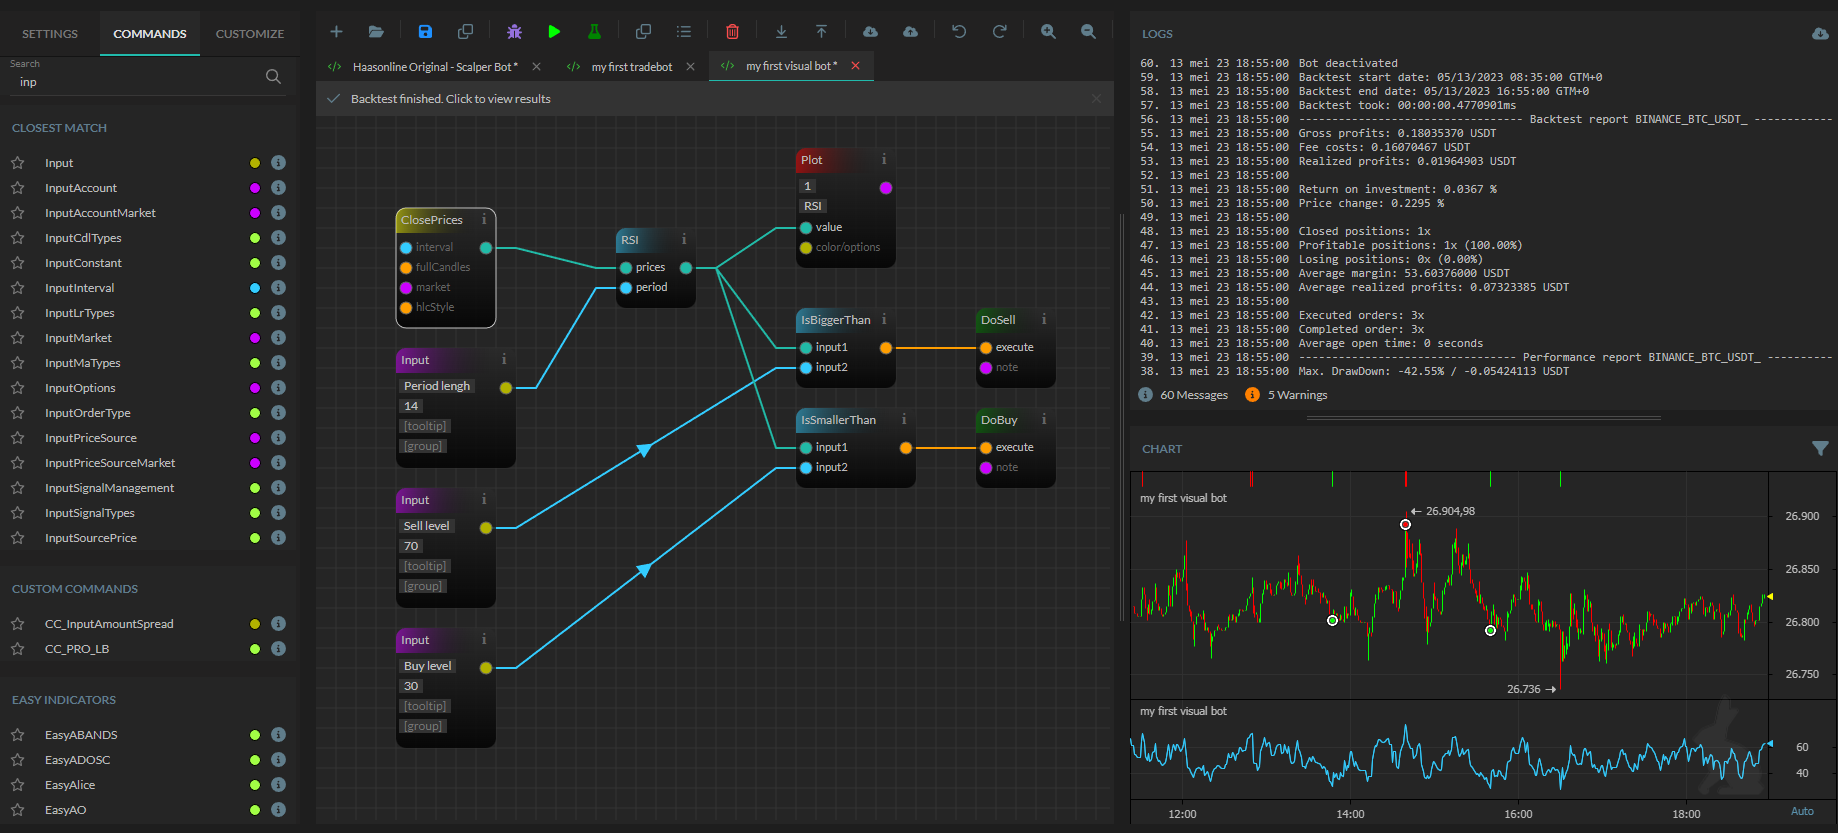
In this small tutorial, we're going to show you how you can create a very basic visual bot.
Step 1: Creating a visual bot
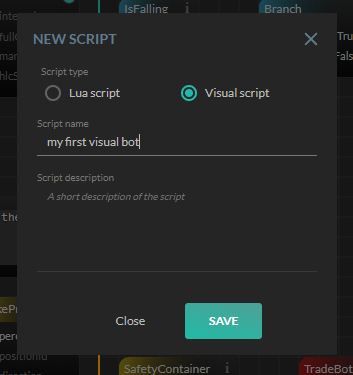
To create a visual bot, you need to go to the left menu and select the "Web-editor". Once selected, a new page will show up. On top of this page you'll find a toolbar - click on the leftmost icon to create a new script. If all goes well, you'll see a window on your screen asking you what sort of script you want to create. Select a visual script and give the visual bot a name.
Step 2: Adding an indicator
In this case, we are going to make a visual RSI bot.
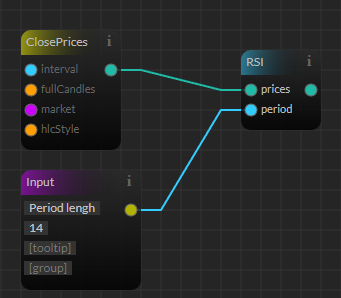
We begin with adding the RSI indicator. We can do so, by going to the "Commands" tab and opening the panel with the "Technical Analysis". In the "Technical Analysis" you will find the "RSI" listed. Select and add this to your drawing.
The "RSI" shows 2 input fields. The RSI wants "prices" and a "period". To give it prices, you need to open the "Price data" pane and select and add the "ClosePrices". Connect the "ClosePrices" to the "RSI" at the "prices" label.
To give the "RSI" a period, we need to add an "Input". Open the "Input fields" pane and select and add the "Input" to your drawing. Connect it to the "RSI" at the "period" field.
So far you now have a working RSI. But that is not enough to create a visual bot. You need to do something with the RSI as well, like showing it and use it in the trade logic.
Step 3: Plotting the indicator
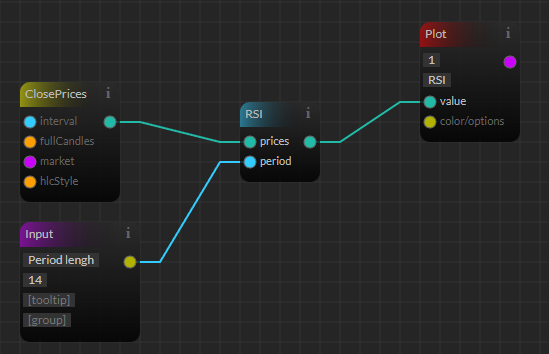
So next would be to Plot the RSI. Open the "Charting" pane and add the "Plot" element to your drawing. Set it up to draw on chart 1 and give it a name like "RSI". Connect the output of the "RSI" to the "value" field of "Plot". Now, your RSI gets drawn.
Step 4: Adding trade logic
To add the trade logic to a visual bot, you need to go to the "Equations" pane. In case of our RSI example, we want to buy and sell at triggers like bigger than and smaller than. So we need to add the "IsBiggerThan" equation. Once added, connect the outcome of the "RSI" to the "IsBiggerThan" at input field "input1".
The "IsBiggerThan" requires a second, trigger, input as well. To make that work, you need to add one more input field. Go to the "Input fields" pane and select and add "Input". Connect the newly created "input" to the "input2" field of the "IsBiggerThan".
"IsBiggerThan" is a equation, so it has a output too. In our case we want to sell if the RSI goes above the 70, so you need to open the "Trade actions Managed" pane and add the "DoSell" action. Connect the outcome of "IsBiggerThan" to the "DoSell"
Repeat the same steps by adding a "IsSmallerThan" equation, so add a "Input" for it too and hook this up to the "DoBuy".
Info
TIP: On top of the "Commands" tab there's a search field. Use this to search for the elements you want to add.