Backtest History
Backtesting Limitations
Backtesting results assume perfect execution and zero slippage, which are unrealistic in live markets. Results may not account for all trading costs, fees, or market impact. Historical backtesting data does not represent expected future performance. Users should not rely solely on backtesting when making trading decisions.
The Backtest History page collects every backtest you've run in one place, so you can compare past results, revisit a promising run, and turn a winning strategy into a live bot.
Backtests arrive here when you run one directly:
- a quick test from the WebEditor toolbar while you're writing a script, or
- a run from a bot's Backtest tab against a historical window.
Backtest Lab runs are not listed here. A single Lab can generate hundreds of backtests (up to 1000), so its results stay on that Lab's own Results tab rather than flooding this list.
To narrow this down to one bot, and to start a new run for it, use Bot Backtests instead.
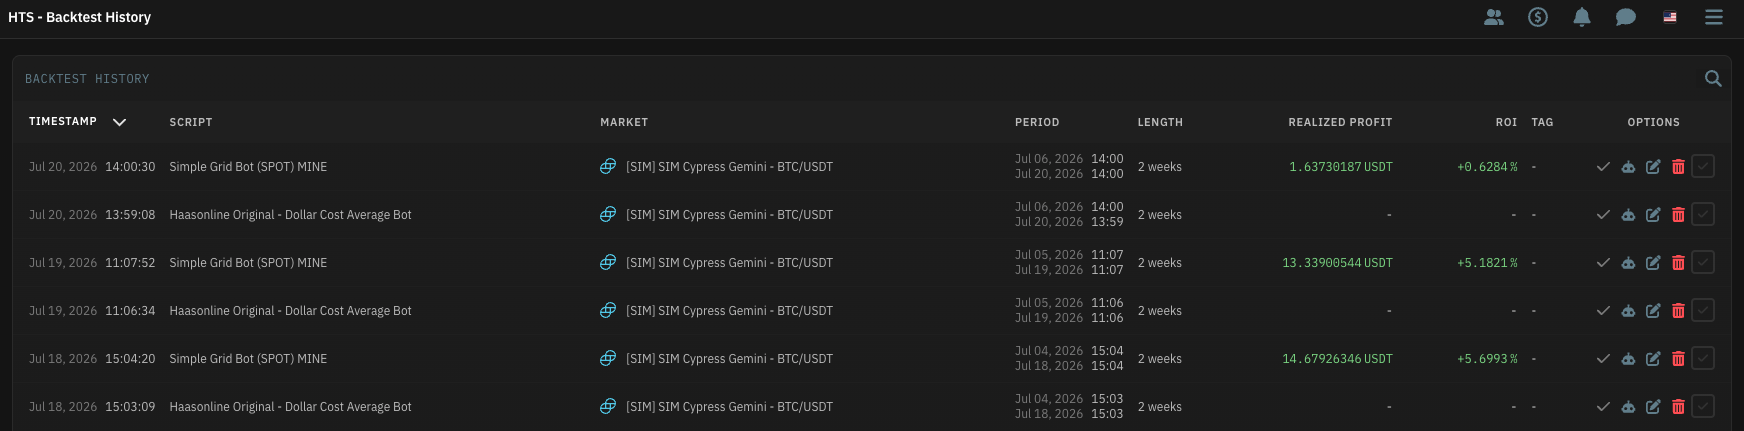
The history list
Each row is one completed backtest. The columns are:
| Column | What it shows |
|---|---|
| Timestamp | When the backtest was run. |
| Script | The HaasScript that was tested. |
| Market | The exchange account and market the test ran on. |
| Period | The historical window tested (start and end date). |
| Length | How long that window is (e.g. 30 days). |
| Realized profit | Profit the strategy would have made over the period, colored green/red. |
| ROI | Return on investment for the run, as a percentage. |
| Tag | Your own custom label for the run (see the Edit action below). |
| Options | Per-row actions — see below. |
Use the search box to filter the list by script name or tag, and click any column header to sort. Backtests that are still running appear in an Active backtests section at the top of the page — showing their status, progress, and time remaining — and drop into the history below once they finish.
Row actions
The icons in the Options column act on a single backtest:
- Check icon — Preserve results. Marks the backtest so it's kept for the long term instead of being cleared out; click again to remove the mark. Preserved runs stay available for later review.
- Robot icon — Create a bot. Builds a trading bot from the backtest's script and settings, so you can deploy the exact strategy you just validated (in paper mode or live).
- Edit icon — Tag. Adds or edits a custom tag on the run, making it easy to group and find specific backtests later.
- Delete icon — Delete. Removes the backtest result from the list.
Each row also has a checkbox — tick several rows to delete them in bulk using the button that appears at the bottom of the page.
Opening a backtest
Click a row to open the backtest details — the full report for that run.
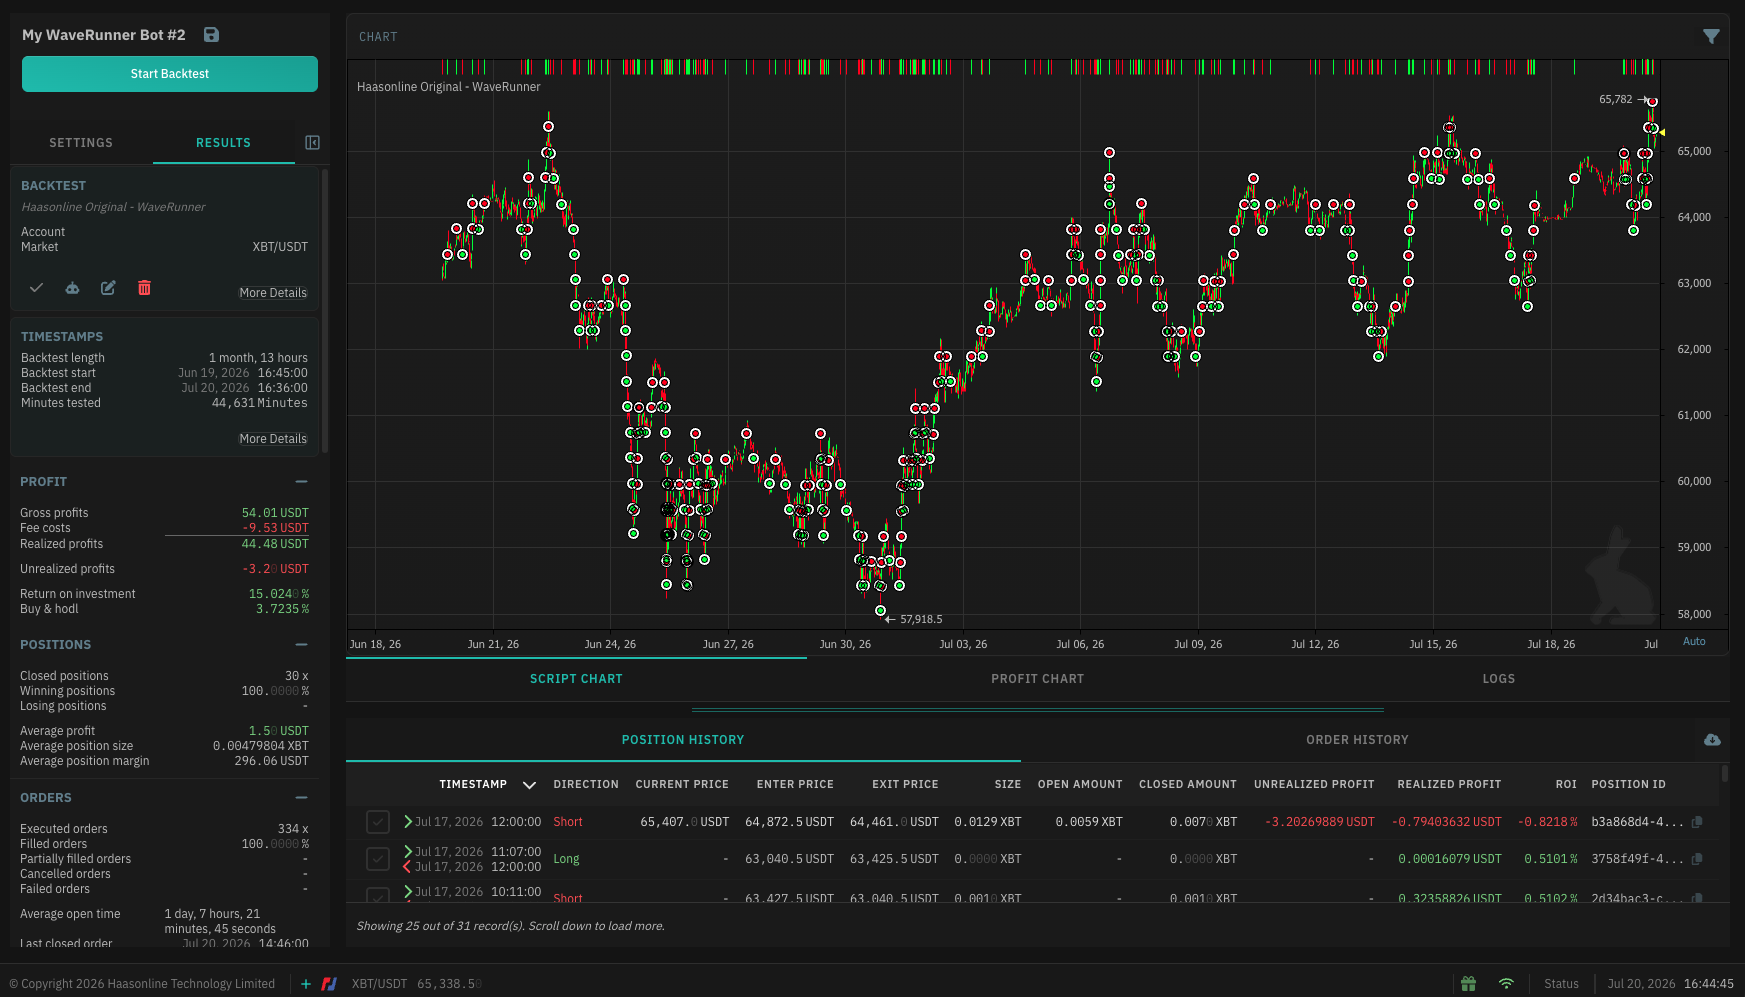
The details view gives you:
- Results — the summary report: profit and fees, return on investment vs. buy-and-hold, position counts and win/loss, order counts, and overall performance stats.
- Settings — the exact script inputs the run used, so you can see (and reuse) the configuration behind the result. Use Export settings to copy them straight into the WebEditor's or a bot's Import settings dialog.
- Script Chart / Profit chart / Logs — the price chart with the strategy's trades plotted, the equity curve over the backtest, and the run's log output.
- Positions & Orders — every position and order the strategy would have opened, so you can trace exactly how it behaved.
Related
- HaasScript — write and quick-test scripts in the WebEditor.
- Backtest Lab — sweep many parameter sets at once and rank the results.