Drawing on the chart
Every price chart in the app has a drawing rail down its left edge: Marketview, the dashboard's market and bot chart widgets, and a bot's Trade Chart. Draw a line once and it's there on every chart of that market, on any device you sign in on.
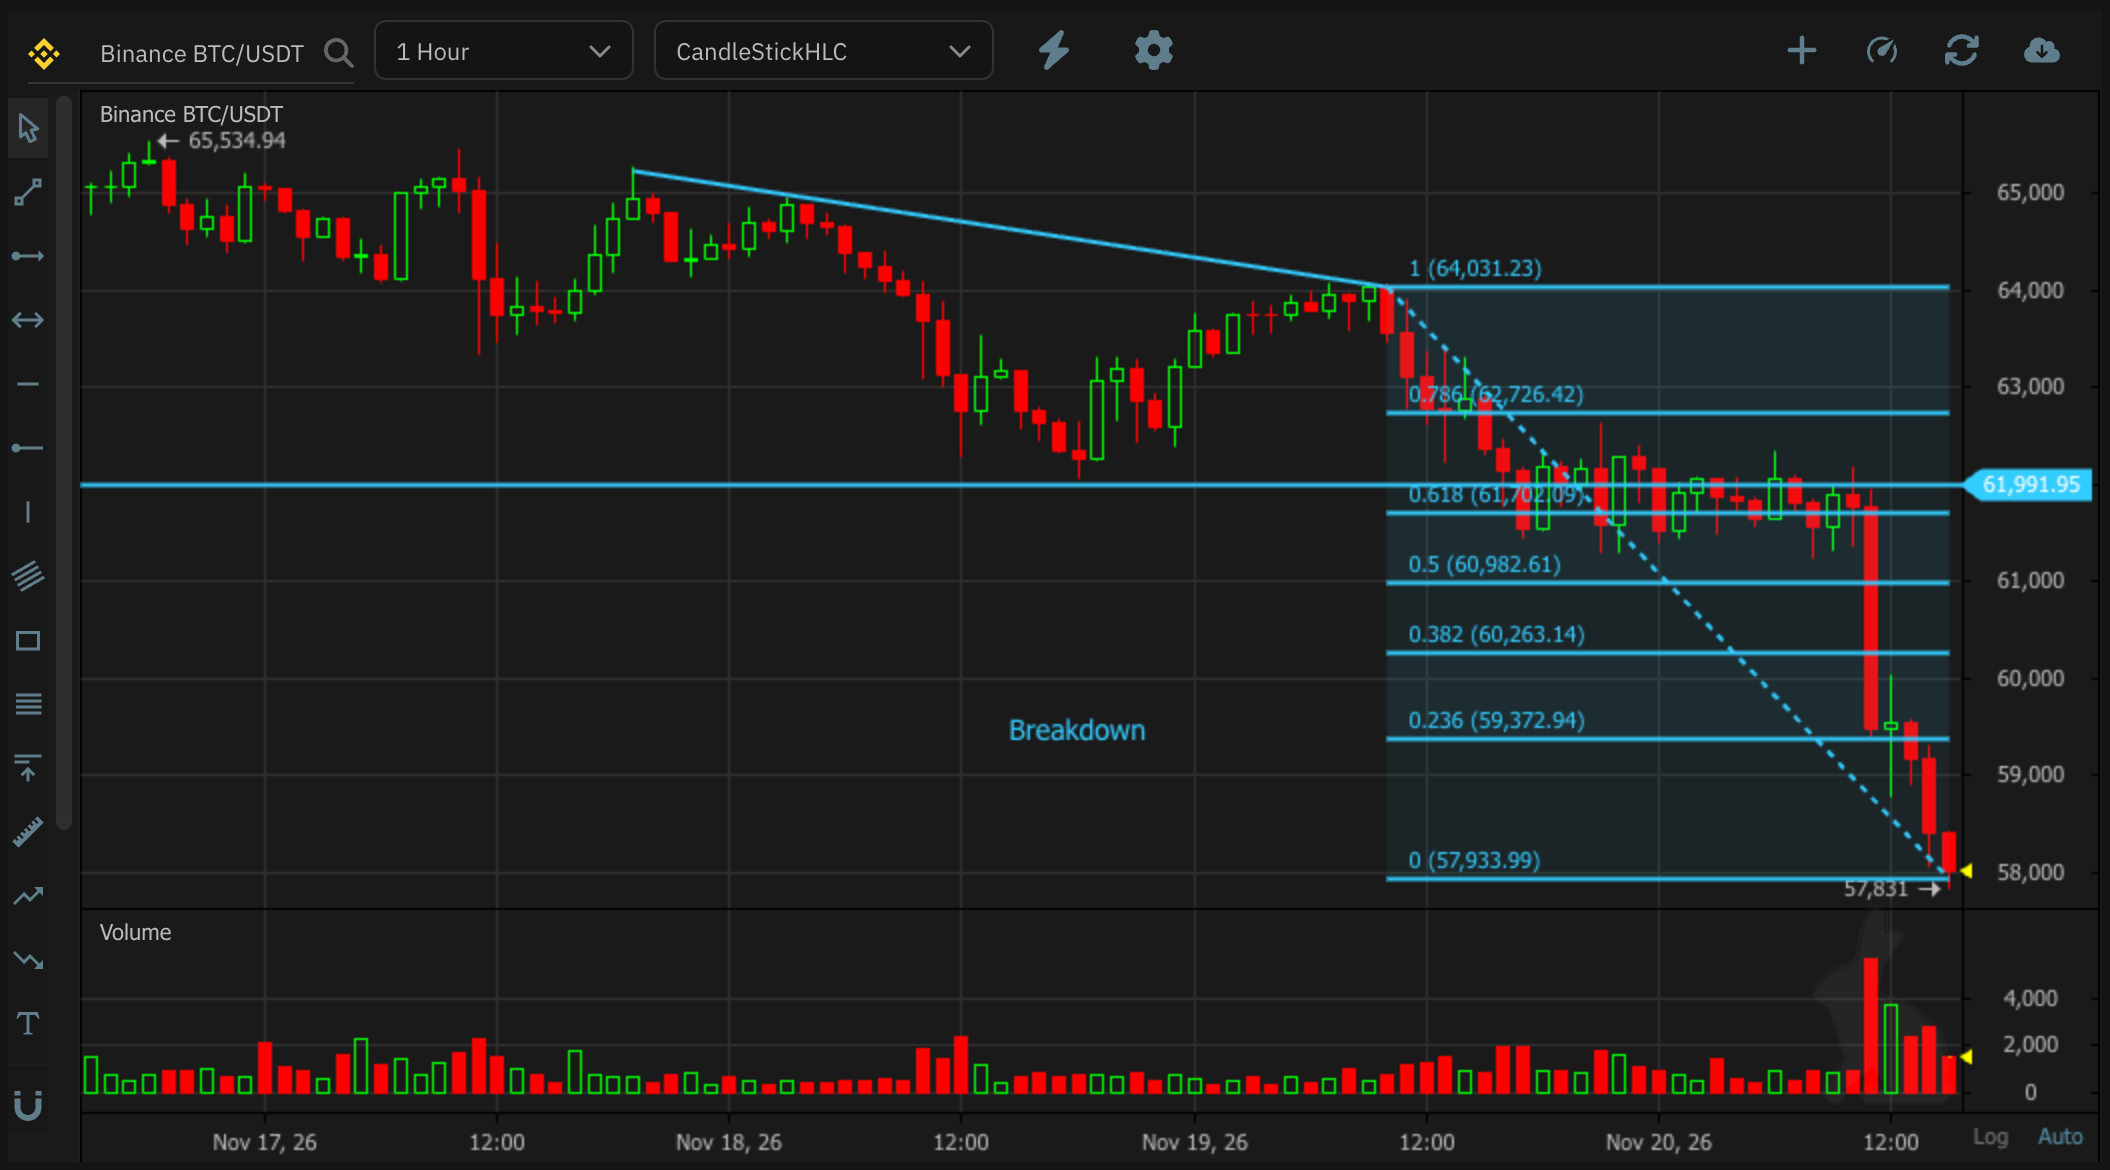
Draw something
- Click a tool on the rail. The chart takes the keyboard, so Escape cancels the tool.
- Click the chart where the drawing starts, then once more for each further point (see the table).
- When it's placed, the rail goes back to the cursor and the new drawing is selected.
On a touch screen (iPad, tablet), one tap picks a tool and one tap places each point.
| Tool | Clicks | What it draws |
|---|---|---|
| Trend line | 2 | A line between two points |
| Ray | 2 | A line from the first point through the second, extended past it to the edge of the chart |
| Extended line | 2 | A line through both points, extended both ways |
| Horizontal line | 1 | A level across the whole chart, with its price on the price axis |
| Horizontal ray | 1 | A level from the point to the right edge |
| Vertical line | 1 | A line at one time |
| Parallel channel | 3 | Two points for the first line, a third for the width of the channel |
| Rectangle | 2 | A box between two corners |
| Fib retracement | 2 | The 0, 0.236, 0.382, 0.5, 0.618, 0.786 and 1 levels between a swing high and low, each with its price |
| Fib extension | 3 | A move (first to second click) projected from a third point, at 0, 0.618, 1, 1.618 and 2.618 |
| Measure | 2 | The change between two points: the price difference, the percentage and the number of bars |
| Long position | 1 | An entry with a target and a stop for a long (see Long and short positions) |
| Short position | 1 | The same for a short |
| Text | 1 | A label. It opens for typing straight away |
Edit, move and delete
- Select: click a drawing. Drag it to move it, or drag one of its points to reshape it.
- Text: double-click a text drawing to change the words. Enter keeps them, Escape puts back what was there.
- Delete: select it and press Delete or Backspace, or click Delete selected drawing on the rail.
- Undo and redo: Ctrl+Z and Ctrl+Shift+Z (or Ctrl+Y); Cmd on a Mac. The rail has the same two buttons.
- Escape steps back one thing at a time: a drawing you're placing, then the picked tool, then the selection.
The rest of the rail
Below the tools (scroll the rail on a short chart):
| Control | What it does |
|---|---|
| Magnet | Snaps the points you place to the nearest candle's open, high, low or close |
| Undo, Redo | As above |
| Color | The color for new drawings, or for the selected one |
| Delete selected drawing | Removes the drawing you selected |
| Hide drawings / Show drawings | Hides every drawing on this chart for now. Picking a tool shows them again |
| Remove all drawings | Removes every drawing on this market, after asking. Undo brings them back. Not on the dashboard widgets' compact rail |
Where drawings are kept
Drawings belong to the market, and they're saved to your account:
- Every chart of that market shows the same drawings: Marketview, the dashboard's market and bot chart widgets, and a bot's Trade Chart. A line drawn on a bot's chart shows on Marketview for that market, and the other way round.
- A change shows on your other open charts of that market straight away, and it follows your account to other browsers and devices.
- Each market has its own set. Binance BTC/USDT and Bybit BTC/USDT don't share drawings.
The dashboard's chart widgets use a compact rail with the same tools, magnet, undo and redo, color, delete and hide; Remove all drawings is left off so it can't be clicked by accident on a small widget.
Long and short positions
The long and short tools plan a trade on the chart: one click sets the entry where you clicked, with a target and a stop at a 2 to 1 reward to risk.
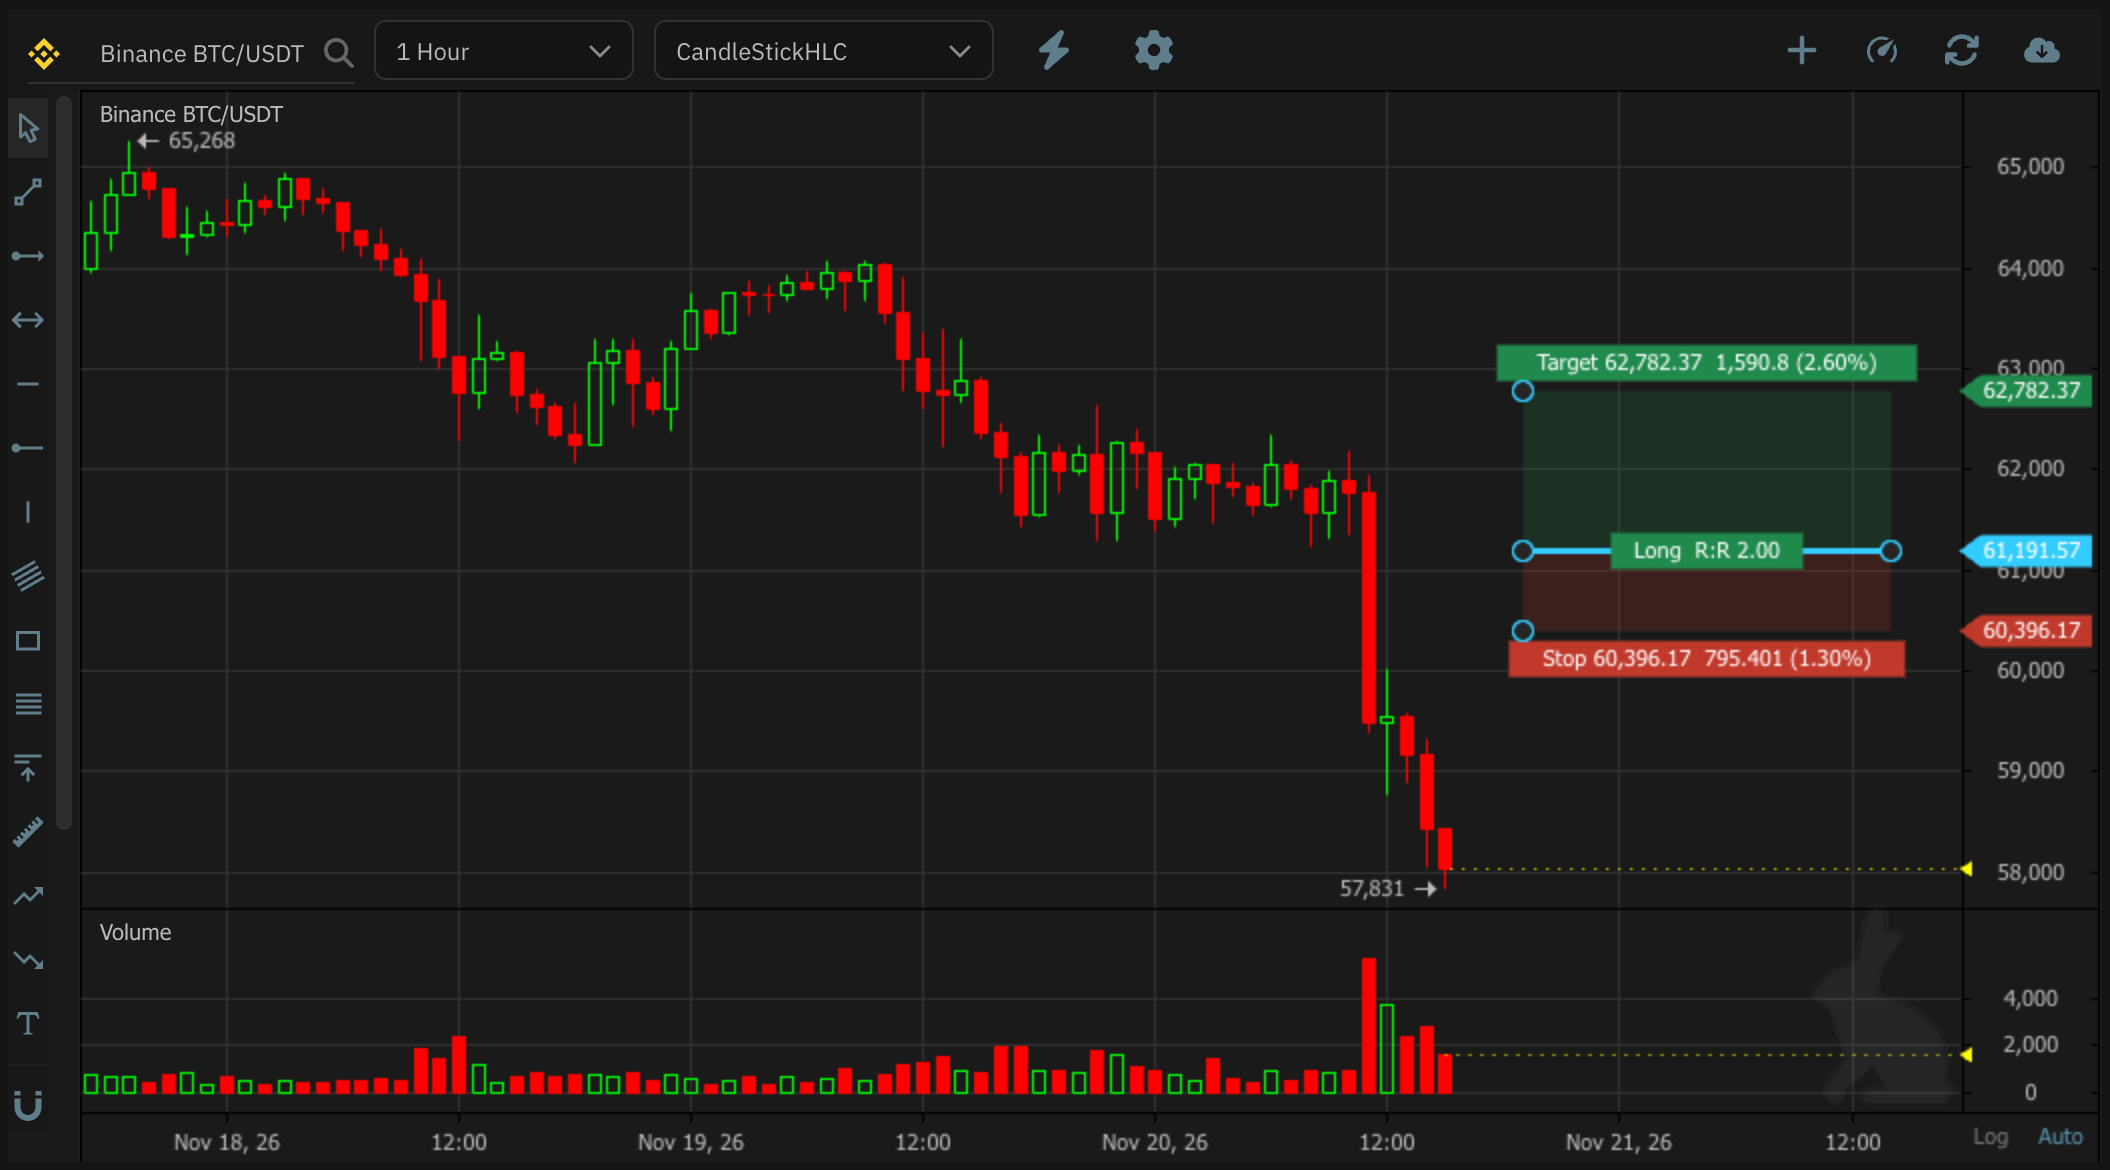
- The label shows Long or Short and the R:R (reward over risk).
- The target and stop labels show each price, the distance to it, and that distance as a percentage of the entry.
- Drag the target, the stop or the entry line to change them; the box and the numbers follow.
- A position can have up to 5 targets.
Start a Smart Trade from a position (Marketview)
On Marketview, right-click inside a long or short to use it:
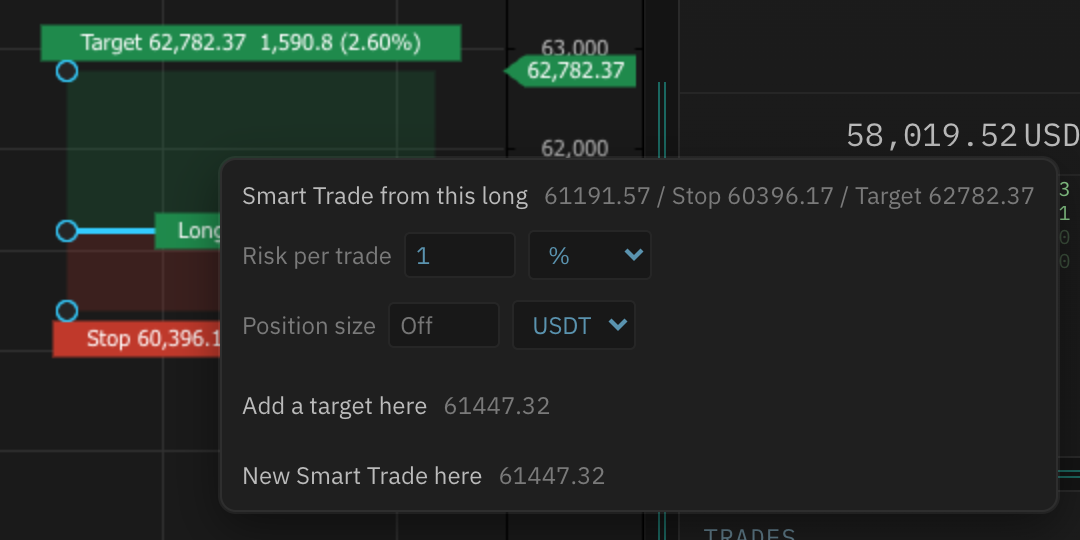
- Smart Trade from this long (or short) opens the Execute Trade window with the box's entry, stop and targets. While it's open, the box and the window stay in step: change one and the other follows.
- Risk per trade sizes the trade so the stop loses that much: a percentage of the account's balance, or an amount in either coin of the market.
- Position size sizes it by amount instead. When it's set, it wins over the risk; clear it to size by the risk again.
- Add a target here adds a target at the price you right-clicked (and Remove target takes one away when you right-click on it).
- New Smart Trade here starts a new Smart Trade from the price you right-clicked, without the box.
See Smart Trade on the chart for following and managing the trade once it's placed.
Note
Smart Trade from a position is only on Marketview. On a bot's chart and on the dashboard widgets, the long and short tools are for planning and measuring only, and a bot's own orders can't be changed from the chart.