Chart indicators
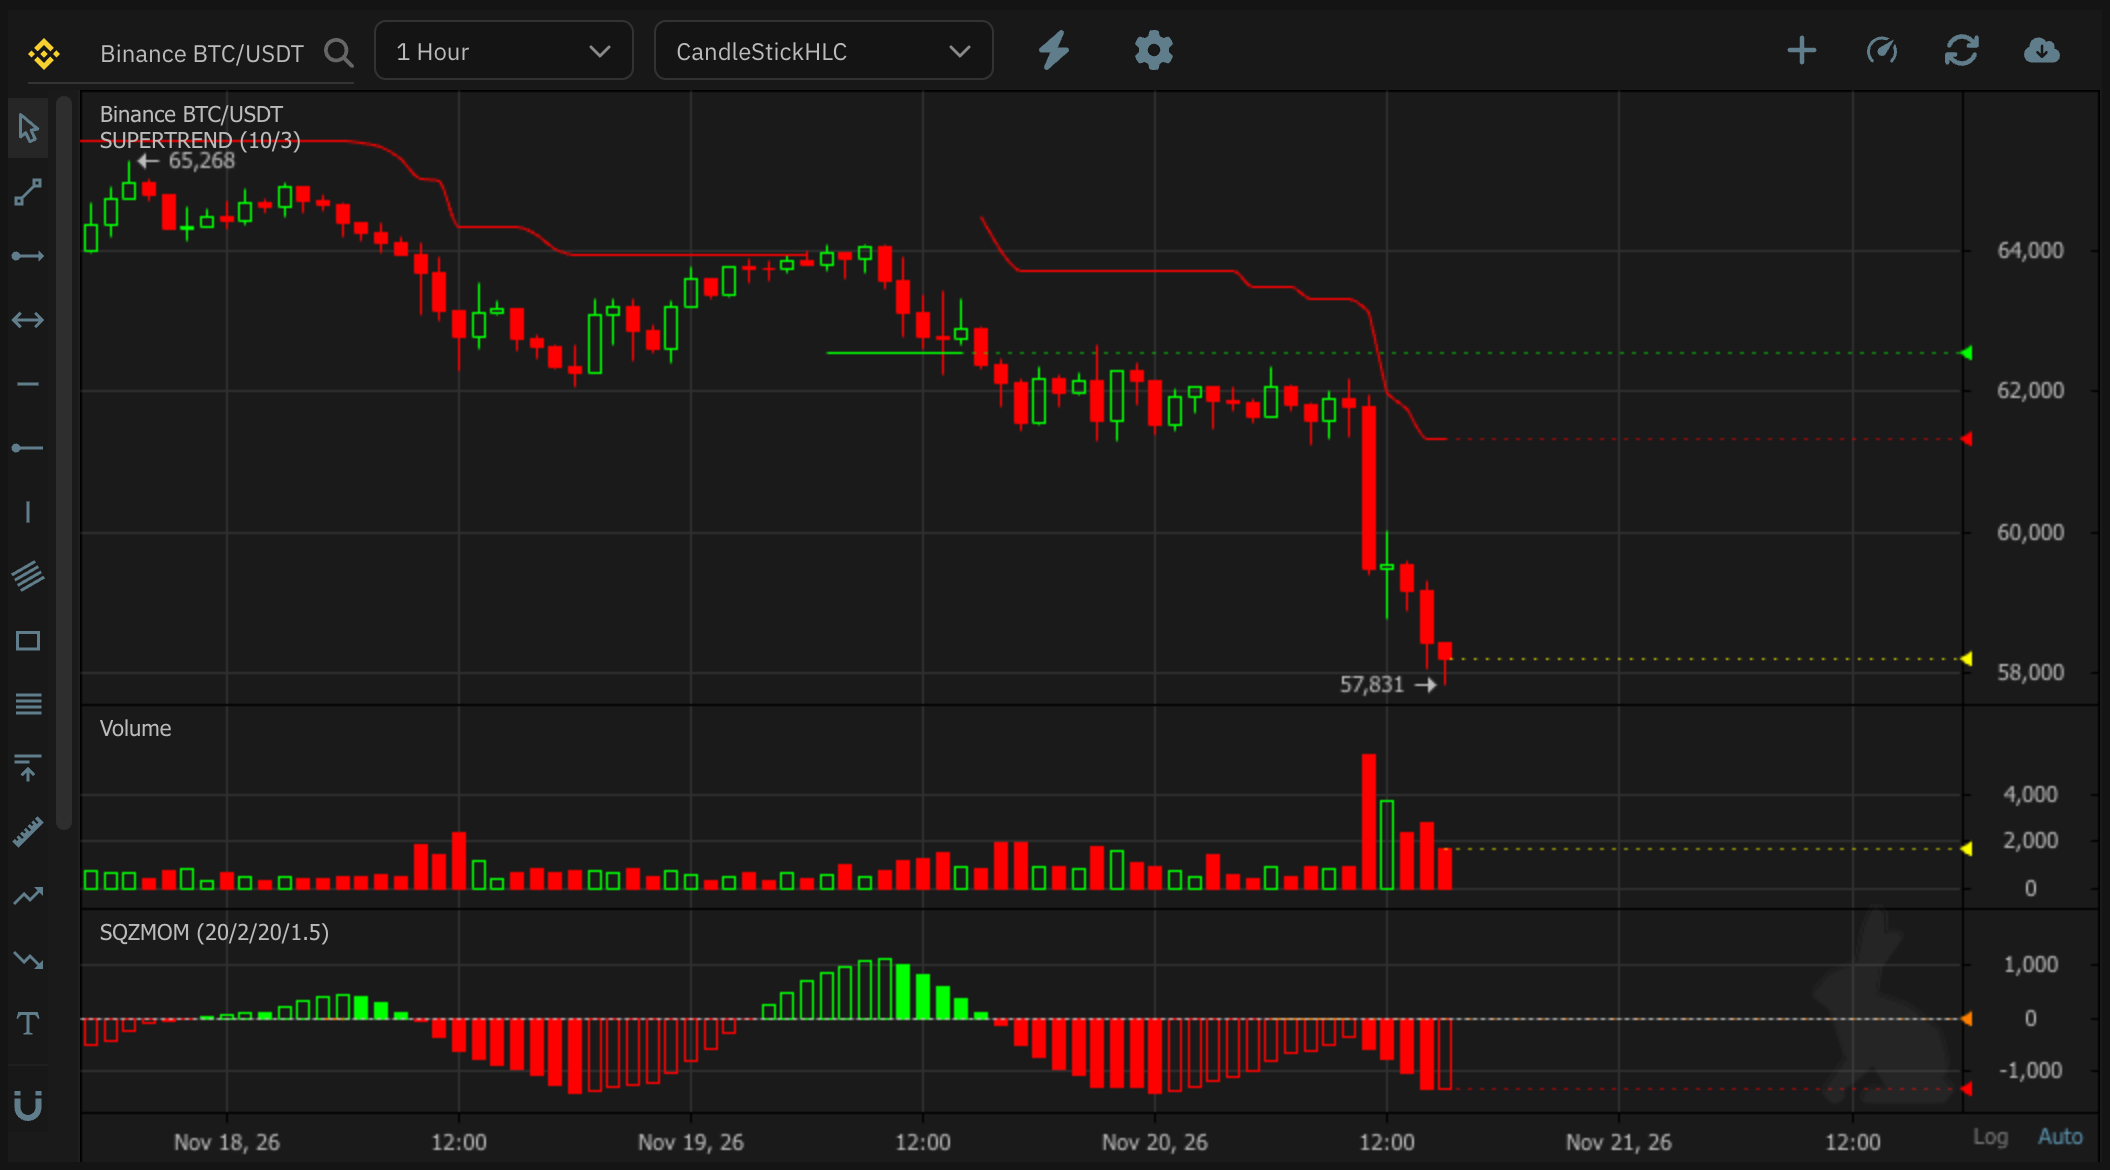
Marketview and the other price charts can show technical indicators over the candles or in their own pane below. There are 99 to pick from. The same indicators exist as HaasScript commands, so what you look at on the chart is what a script can trade on.
Add an indicator
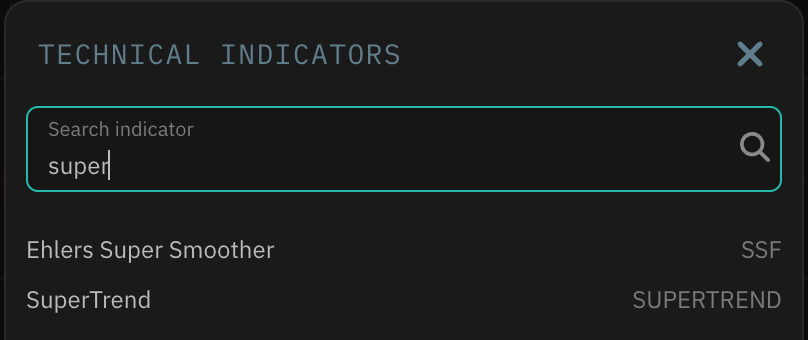
- Click the lightning icon (Add indicator) on the chart's toolbar.
- Type part of the name or the abbreviation, for example
superorVWAP. - Click the indicator. It's added with its default settings.
Change, hide or remove it
Each indicator is listed at the top left of the chart or of its pane, with its settings in brackets, for example SUPERTREND (10/3). Hover it for three icons:

- Configure (the gear, or click the name): change its settings.
- Show/hide (the eye): hide it without removing it.
- Delete (the bin): remove it.
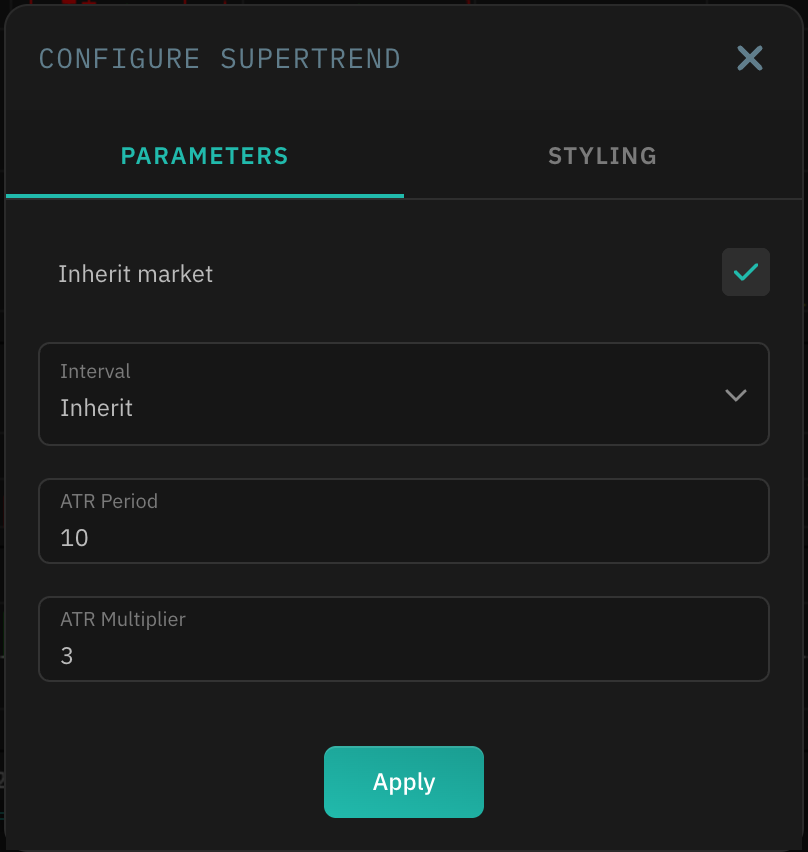
The configure window has two tabs:
- Parameters: the indicator's own settings (lengths, multipliers, levels, the price it uses). Inherit market and Interval: Inherit use the chart's market and interval; untick or change them to compute the indicator on another market or interval. Click Apply to redraw it.
- Styling: the color, width and style of each line.
Tip
An indicator that keeps a running average (EMA, DEMA, TEMA, T3, RMA, Welles Wilder's Smoothing) loads more candles as its length goes up, so a long length starts from settled values instead of a rough first guess.
All chart indicators
Names and abbreviations are as they appear in the list. New marks indicators added in November 2026. The last column is the HaasScript Easy command that adds the same indicator to a bot with its own inputs and signal; most also have a plain HaasScript command named after the abbreviation (for example SUPERTREND() and RSI()), listed in the Technical Analysis reference.
Moving averages and trend
| Indicator | Abbreviation | What it's for | Easy command |
|---|---|---|---|
| Simple Moving Average | SMA | The plain average of the last N prices | EasyMA |
| Exponential Moving Average | EMA | An average that weights recent prices more | EasyMA |
| Double Exponential Moving Average | DEMA | An EMA with less lag | EasyMA |
| Triple Exponential Moving Average | TEMA | An EMA with even less lag | EasyMA |
| Weighted Moving Average | WMA | A linearly weighted average | EasyMA |
| Triangular Moving Average | TRIMA | A double-smoothed average | EasyMA |
| Moving Average | MA | Any moving average type, picked in its settings | EasyMA |
| Hull Moving Average | HMA | A fast, smooth average with little lag (New) | EasyHMA |
| Running Moving Average (RMA / SMMA) | RMA | Wilder's smoothed average, as Pine Script's ta.rma (New) |
EasyRMA |
| Welles Wilder's Smoothing | WWS | Wilder's smoothing seeded from the first price | |
| Wilder Moving Average | WiMA | Wilder's moving average | |
| Ehlers Super Smoother | SSF | A smoothing filter that removes short-term noise with little lag (New) | EasySUPERSMOOTHER |
| Zero-Lag Exponential Moving Average | ZLEMA | An EMA corrected for lag (New) | |
| Zero-Lag Moving Average | ZLMA | Any moving average type, corrected for lag | EasyZLMA |
| Kaufman's Adaptive Moving Average | KAMA | Speeds up in trends and slows down in noise | |
| Mesa Adaptive Moving Average | MAMA | Adapts its speed to the market's cycle | |
| Tillson Moving Average | T3 | A smooth, low-lag average | |
| Volume Weighted Moving Average | VWMA | An average weighted by volume (New) | EasyVWMA |
| SuperTrend | SUPERTREND | A trailing line from the average true range that flips with the trend (New) | EasySUPERTREND |
| Parabolic SAR | SAR | Trailing stop-and-reverse points | EasySAR |
| Parabolic SAR Extended | SAREXT | SAR with separate settings for longs and shorts (New) | |
| Ichimoku Clouds | ICHIMOKU | Trend, support and resistance from several averages | EasyICHIMOKU |
| Linear Regression | LINEARREG | The best-fit line through recent prices | EasyLINEARREG |
| Time Series Forecast | TSF | Where the regression line points next | |
| Hilbert Transfrom Trend Line | HT_TRENDLINE | An instant trend line from the Hilbert transform | |
| Aroon Indicator | AROON | How recently the high and the low were made | EasyAROON |
| Aroon Oscillator | AROONOSC | Aroon up minus Aroon down | EasyAROONOSC |
| Average Directional Index | ADX | Trend strength, whatever its direction | |
| Average Directional Index Rating | ADXR | A smoothed ADX | |
| Directional Index | DX | The raw directional movement behind ADX | EasyDX |
| Directional Movement Index | DMI | +DI, -DI and ADX together | EasyDMI |
| Choppiness Index | CHOP | Whether the market trends or chops sideways | |
| Schaff Trend Cycle | STC | A fast trend oscillator from MACD and stochastics (New) | EasySTC |
Bands, channels and volatility
| Indicator | Abbreviation | What it's for | Easy command |
|---|---|---|---|
| Bollinger Band | BBANDS | A moving average with bands at a number of standard deviations | EasyBBANDS |
| Bollinger %B | %B | Where the price sits within the bands: 0 at the lower band, 1 at the upper (New) | EasyBBANDSB |
| Bollinger BandWidth | BBW | How wide the bands are, relative to the middle (New) | EasyBBANDSW |
| Keltner Channel | KELTNER | A moving average with bands from the average true range | EasyKELTNER |
| Donchian Channel | DONCHIAN | The highest high and lowest low over a period | EasyDONCHIAN |
| Acceleration Bands | ABANDS | Bands that widen with the candles' range | EasyABANDS |
| Squeeze Momentum | SQZMOM | Bollinger Bands inside the Keltner Channel (a squeeze) and the momentum out of it (New) | EasySQZMOM |
| Chandelier Exit Long | CEL | A trailing stop for longs from the average true range | |
| Chandelier Exit Short | CES | The same for shorts | |
| Average True Range | ATR | The average size of a candle's range, gaps included | |
| Normalized Average True Range | NATR | ATR as a percentage of the price | |
| True Range | TRANGE | One candle's true range | |
| Standard Deviation | STDDEV | How far prices spread from their average | |
| Variance | VAR | The square of the standard deviation | |
| Average Deviation | AVGDEV | The average distance from the mean |
Momentum and oscillators
| Indicator | Abbreviation | What it's for | Easy command |
|---|---|---|---|
| Relative Strength Index | RSI | Overbought and oversold, from 0 to 100 | EasyRSI |
| Fast Relative Strength Index | Fast RSI | A short RSI with a signal line | EasyFastRSI |
| Slow Relative Strength Index | Slow RSI | A smoothed RSI with a signal line | EasySlowRSI |
| Connor's Relative Strength Index | CRSI | RSI, streak length and rate of change combined | EasyCRSI |
| UpDown Relative Strength Index | UDRSI | An RSI variant built from up and down moves | EasyUDRSI |
| Stochastic-RSI | STOCHRSI | Stochastics applied to the RSI | EasySTOCHRSI |
| Full Stochastics | STOCH | Where the close sits in the recent range, smoothed | EasySTOCH |
| Fast Stochastics | STOCHF | The unsmoothed stochastic | EasySTOCHF |
| Simple Stochastic | SSTOCH | A stochastic with a signal line | EasySSTOCH |
| Moving Average Convergence Divergence | MACD | The gap between a fast and a slow EMA, with a signal line | EasyMACD |
| MACD Fixed 12/26 | MACDFIX | MACD with the standard 12 and 26 (New) | |
| Moving Average Convergence Divergence Extended | MACDEXT | MACD with any average type for each line | |
| Percentage Price Oscillator | PPO | MACD as a percentage | EasyPPO |
| Absolute Price Oscillator | APO | The gap between two averages, in price | EasyAPO |
| WaveTrend | WAVETREND | A channel oscillator with overbought and oversold levels and a signal line (New) | EasyWAVETREND |
| Commodity Channel Index | CCI | How far the price is from its average | EasyCCI |
| Chande Momentum Oscillator | CMO | Up moves against down moves, from -100 to 100 | EasyCMO |
| Williams %R | WILLR | Where the close sits in the recent range, from -100 to 0 | EasyWILLR |
| Ultimate Oscillator | ULTOSC | Buying pressure over three periods | EasyULTOSC |
| True Strength Index | TSI | Double-smoothed momentum | EasyTSI |
| Triple-smoothed moving average | TRIX | The rate of change of a triple-smoothed EMA | EasyTRIX |
| Momentum | MOM | The price change over N candles | EasyMOM |
| Rate-of-Change | ROC | The price change over N candles, as a percentage | EasyROC |
| Rate of Change Percentage | ROCP | The change as a fraction of the old price (New) | |
| Awesome Oscillator | AO | A fast minus a slow average of the median price | EasyAO |
| Coppock Curve | COPPOCK | A long-term momentum curve | EasyCOPPOCK |
| Know Sure Thing | KST | Four rates of change combined | EasyKST |
| Detrended Price Oscillator | DPO | Cycles with the trend taken out | EasyDPO |
| Kairi Relative Index | KRI | How far the price is from its average, as a percentage | EasyKRI |
| Intraday Momentum Index | IMI | RSI built from each candle's open and close | EasyIMI |
| Balance Of Power | BOP | Buyers against sellers within each candle | EasyBOP |
| Hilbert Transfrom Dominant Cycle Period | HT_DCPERIOD | The length of the market's current cycle | |
| Hilbert Transfrom Dominant Cycle Phase | HT_DCPHASE | Where in that cycle the market is | |
| Hilbert Transfrom Phasor Components | HT_PHASOR | The cycle's in-phase and quadrature parts | |
| Hilbert Transfrom SineWave | HT_SINE | A sine wave of the cycle, to time turns |
Volume
| Indicator | Abbreviation | What it's for | Easy command |
|---|---|---|---|
| VWAP (daily, UTC) | VWAP | The volume-weighted average price, starting over at 00:00 UTC each day, with optional bands (New) | EasyVWAP |
| VWAP (rolling) | RVWAP | The volume-weighted average price over the last N candles, with optional bands (New) | EasyRVWAP |
| Chaikin Money Flow | CMF | Buying against selling pressure from volume (New) | EasyCMF |
| Money Flow Index | MFI | RSI weighted by volume | EasyMFI |
| On-Balance Volume | OBV | A running total of volume, up or down with the close | EasyOBV |
| Accumulation/Distribution Line | AD | A running total of money flow | |
| Accumulation/Distribution Oscillator | ADOSC | The momentum of the A/D line | EasyADOSC |
Prices and comparison
| Indicator | Abbreviation | What it's for | Easy command |
|---|---|---|---|
| Average Price | AVGPRICE | The average of open, high, low and close | |
| Median Price | MEDPRICE | The middle of high and low | |
| Typical Price | TYPPRICE | The average of high, low and close | |
| Weighted Close Price | WCLPRICE | High, low and close, with the close counted twice | |
| Mid Price | MIDPRICE | The middle of the highest high and lowest low over N candles | |
| Midpoint Price | MIDPOINT | The middle of the highest and lowest price over N candles | |
| Candle Pattern | CDL | Marks the candlestick pattern you pick | EasyCDL |
| Beta | BETA | How strongly the chart's market moves with a second market (New) | |
| Correlation | CORREL | How closely the chart's market moves with a second market, from -1 to 1 (New) |
Beta and Correlation have a Compare market setting, Binance BTC/USDT by default. On a 1-minute chart, VWAP (daily, UTC) can reach back 1000 candles, so from 16:40 UTC onward it's a VWAP over the last 1000 minutes rather than one from 00:00.